How Satta Matka Result Charts Work And Why Past Results Cannot Predict Future Outcomes
अपडेटेड 15 Oct 2026
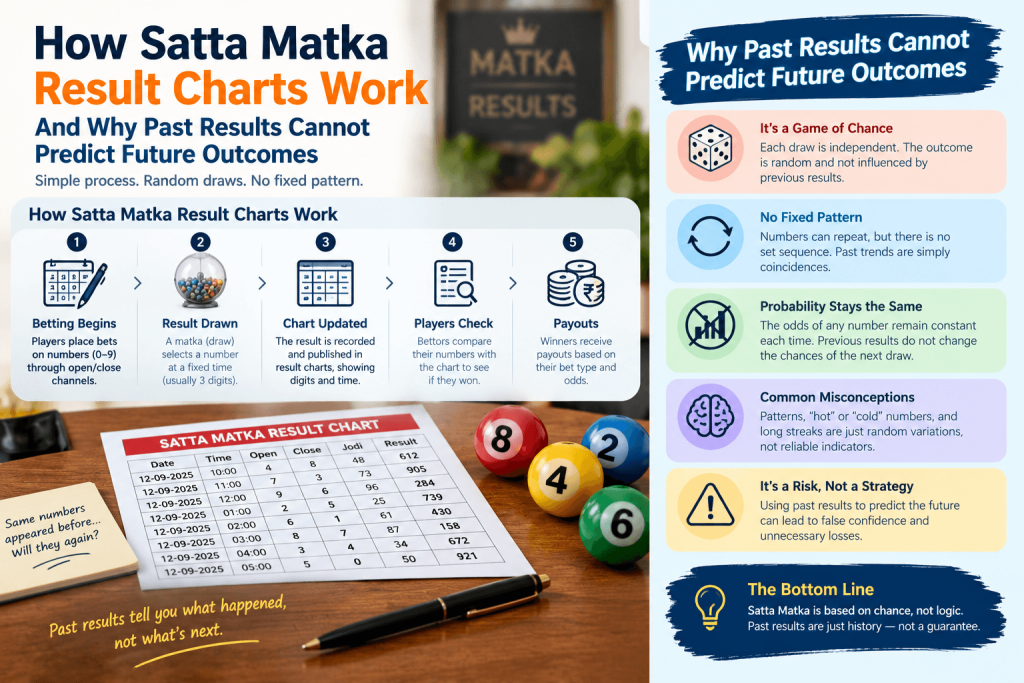
A chart filled with numbers can look like a puzzle. Some numbers appear often. Others seem to vanish for weeks. When a sequence repeats, it may look like a pattern with a hidden meaning.
Satta Matka result charts record the outcomes of past number-based gambling draws. They often arrange results by date, game name, and number combination.
These charts serve as historical records. They show what was reported in earlier rounds, but they cannot reveal what will happen next.
The reason lies in probability.
When a draw is genuinely random and independent, each result comes from a new event. Earlier numbers do not influence the next outcome.
Think of tossing a fair coin. Five heads in a row may seem unusual, but the sixth toss still has a 50% chance of landing on heads.
The same principle applies to independent number draws.
Understanding how result charts work helps explain why repeated numbers, long gaps, and apparent trends can emerge through chance alone.
The key distinction is simple: a record of past results is not a reliable forecast of future outcomes.
How Satta Matka Result Charts Organize Historical Data
Satta Matka result charts collect past draw outcomes and place them in a structured record. Most charts use rows and columns to separate dates, game names, and reported numbers.
A typical chart may show opening results, closing results, and number combinations linked to each draw. The exact format varies between games and publishers.
Some charts cover a single week. Others store months or years of results, making it easier to review how numbers appeared over time.
This approach resembles a weather log. A record of last month’s temperatures shows what happened, but it cannot tell us the exact temperature on a future date.
Digital gambling platforms also use historical records. For example, discussions of desi play slots online may include previous game outcomes or session histories. Such records describe completed events rather than revealing the next random result.
The key difference lies in how the data is used.
Historical data can help researchers count results, study frequency, and examine how number sequences behave.
However, a chart does not explain whether the underlying draw was fair, independent, or free from outside influence.
It only shows the results that someone recorded.
A result chart is a record of past events, not a system for predicting future numbers.
Why Repeated Numbers Do Not Reveal A Predictable Pattern
People naturally look for patterns. When the same number appears several times, it can seem as though the chart contains a hidden rule.
Yet random events often produce clusters.
Imagine rolling a fair six-sided die 60 times. Each face has the same chance on every roll. Still, the results will rarely show exactly ten appearances of each number.
One face might appear 14 times, while another appears only six times. Such differences can occur through chance.
The same principle applies to independent number draws. A number that appeared yesterday is not more or less likely to appear tomorrow simply because of its history.
This is known as statistical independence.
Another common mistake is the gambler’s fallacy. It occurs when someone believes a result becomes more likely because it has not appeared recently.
For example, ten consecutive coin tosses landing on heads do not make tails more likely on the next fair toss.
Past results cannot change the physical or mathematical rules of a new independent event.
A visible pattern in historical data is not proof of a predictable process.
How Probability Explains Gaps And Number Clusters
A result chart may show one number appearing several times in a week, while another remains absent for months.
These gaps can seem strange, but probability does not require outcomes to follow a neat schedule.
Consider a fair coin. Each toss has two possible results, each with a 50% chance. Over thousands of tosses, the share of heads will tend to move closer to half.
This is an example of the law of large numbers.
However, the law does not promise an even split after ten, twenty, or fifty tosses. Short sequences can contain long runs of the same result.
The same distinction matters when examining number charts.
Long-term frequency describes how often an outcome appears across many trials. It does not determine when that outcome must appear next.
A number can remain absent for a long period without becoming overdue.
These principles assume the draws are fair and independent. If a system contains bias or outside interference, its results may behave differently.
Even then, a chart alone cannot prove what caused an unusual sequence.
Why Historical Charts Cannot Guarantee Accurate Predictions
A prediction needs evidence that past events contain useful information about future ones.
In a fair, independent number draw, that link does not exist.
Suppose a chart shows that one number appeared more often than others during the past month. This tells us about the recorded sample, not the next result.
A larger chart provides more data, but more historical results do not make an independent future draw predictable.
There is also a problem with data quality.
Some charts may contain missing entries, reporting delays, or incorrect numbers. Without independent checks, readers cannot know whether the records are complete.
Even accurate charts have limits. They show outcomes but may reveal nothing about how the draws took place.
A statistical test can sometimes detect signs of bias across many results. However, unusual patterns alone cannot establish that a system is flawed or identify its next outcome.
Historical analysis can describe past events and test assumptions. It cannot turn chance into certainty.
What Satta Matka Result Charts Can Actually Tell Us
Satta Matka result charts provide a record of numbers reported in past draws. They can show how often a result appeared, when it occurred, and whether unusual sequences formed.
These observations have value as historical data, but they have clear limits.
Repeated numbers do not prove that a sequence will continue. Long gaps do not mean that an absent number is due to appear. In a fair, independent draw, each new outcome follows the same probability rules regardless of earlier results.
Charts also cannot establish fairness on their own. That requires reliable records and evidence about how the draws take place.
The central lesson is that describing the past and predicting the future are different tasks.
A chart can answer what happened. Probability explains why some patterns appear through chance. Neither provides a dependable way to forecast the next independent result.
सट्टा (सट्टा मटका) भारत के अधिकांश हिस्सों में अवैध जुआ है और इसमें फ़ायदा खिलाड़ी का नहीं, ऑपरेटर का होता है। यह साइट केवल जानकारी के लिए है।